SEE BELOW TO DETERMINE FOR YOURSELF IF THESE TAX CUTS SHOULD BE PERMANENT.
SOURCE
On Income, Our Top Continues To Clobber Our Bottom
A new analysis of just-released IRS data reveals the widest income gap between America's top 1 percent and bottom 90 since right before the Great Depression.
March 31, 2008
By Sam Pizzigati
Economists can't tell us much about the future. But the best of them can tell us a great deal about the past. Over recent years, two of those best — Emmanuel Saez and Thomas Piketty — have been parsing annual data from the IRS to paint a picture of where America's income dollars are going. They've just released their latest picture. It's not pretty.
income gapDollars are now flowing into the pockets of America's fabulously rich, the new Saez-Piketty data show, at their fastest rate in nearly 80 years.
In 2006, the most current year with IRS tax return totals available, the most affluent 1 percent of American households took in 20.3 percent of American income dollars.
"Not since 1928, just before the Great Depression," observes an analysis of the Saez-Piketty data by the Center for Budget and Public Policy's Aviva Aron-Dine, "has the top 1 percent held such a large share of the nation's income."
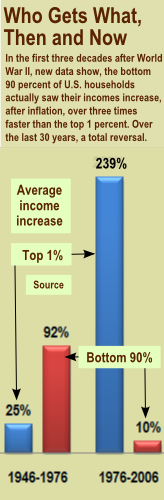
Between 2005 and 2006, the new Saez-Piketty data indicate, the average income of the top 1 percent of U.S. households increased $73,000, after inflation. The bottom 90 percent of U.S. households, over that same span, saw their incomes jump by $20, not enough to offset the cost of a parking ticket.
The picture the Saez-Piketty numbers paint gets significantly uglier when we zero in on the wealthiest of the wealthy — and look closely at how prodigiously their incomes have ballooned since the mid 20th century.
In 1956, households in America's top tenth of 1 percent reported incomes that averaged just under $1.1 million. That's in inflation-adjusted 2006 dollars.
In 2006, this top 0.1 percent averaged $6.3 million. In other words, the real incomes of these affluents have multiplied nearly six-fold over the past half-century, a 476 percent increase.
Over the same 50-year period, the real average incomes of America's bottom 90 percent increased just 32 percent, from $23,068 to $30,374.
But this 32 percent figure actually distorts the historical trend line. Over recent decades, the average incomes of the bottom 90 percent of American households have actually dropped. These incomes increased steadily from the 1950s into the early 1970s, hitting $34,065 in 1973. Since then, the average incomes of America's bottom 90 percent have dipped 11 percent.
Could this picture get any uglier? Sure can. Just consider the incomes of America's top hundredth of 1 percent. These incomes — once again, after factoring in inflation — jumped from an average $3.7 million in 1956 to $29.6 million in 2006, an amazing increase of 693 percent.
No comments:
Post a Comment